OpenView also provides a great free resource on better keywords/customers at the end of the article: http://labs.openviewpartners.com/ebook/better-keywords-better-customers-a-guide-to-keyword-generation/
I'll post the infographics below with a highlight of what's interesting for each one, but people should feel free to look over everything.
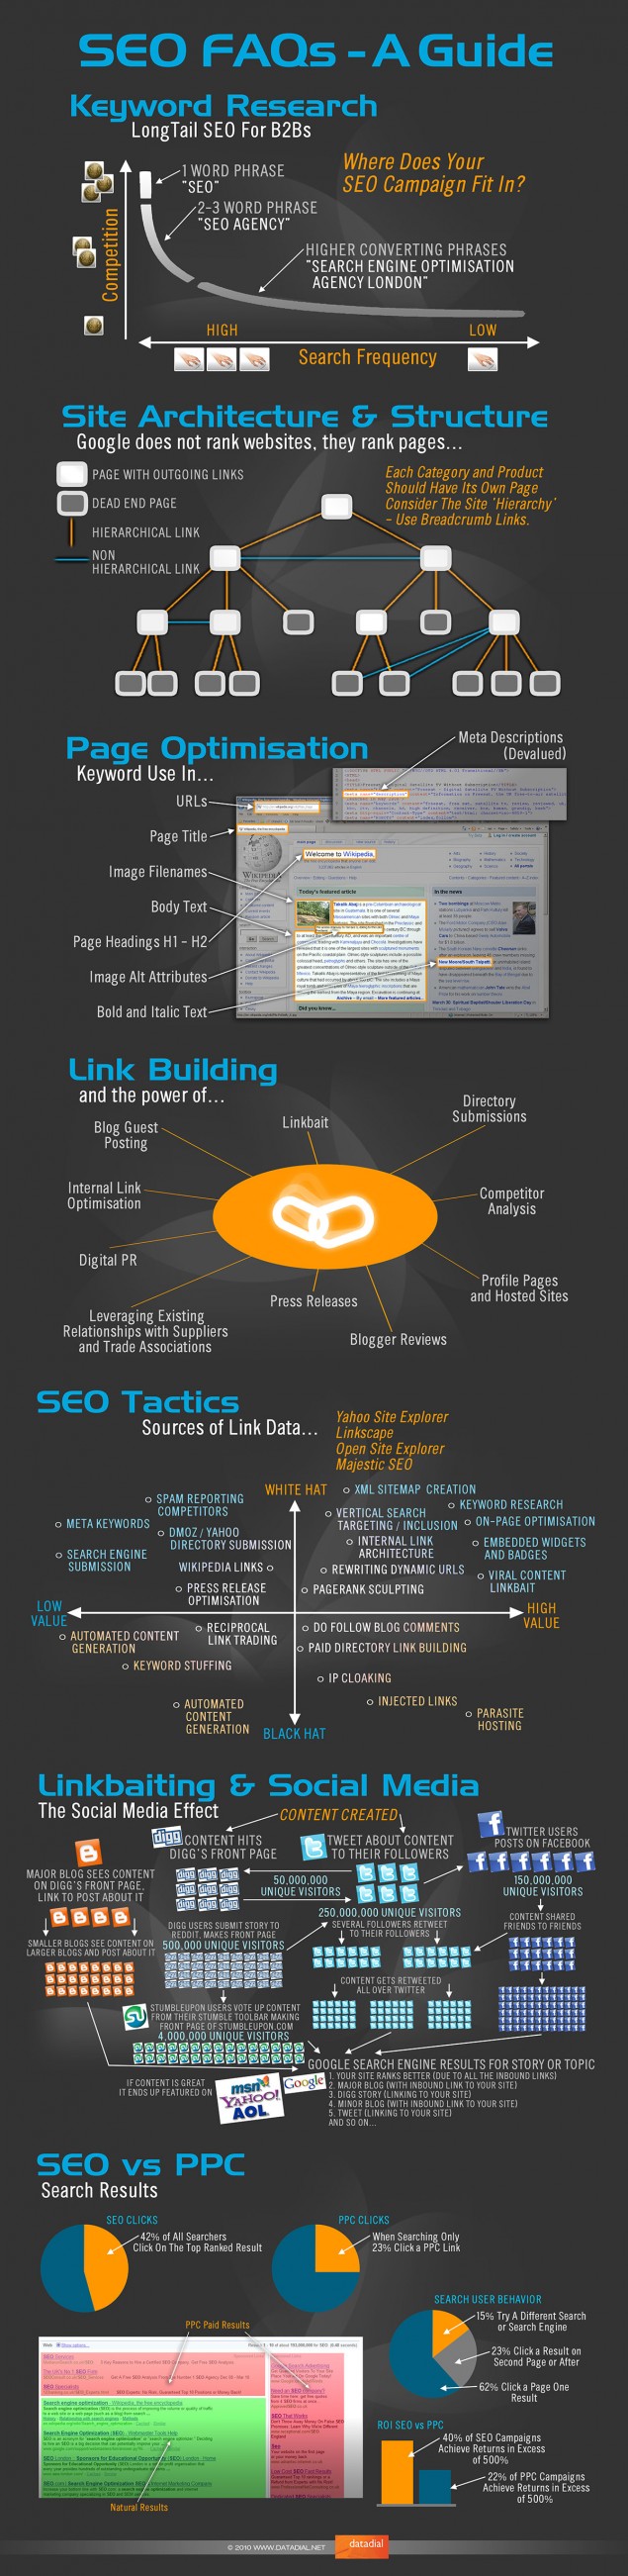
In the first graphic, there is a great snapshot of website optimization. We covered this in class when we went over headings, page titles, and other aspects of the page, but this is a really great snapshot of it. There's also a nice 2x2 matrix of white hat vs. black hat and low value vs. high value for people that are new to SEO and are not sure if what they are doing will end up hurting more than helping.
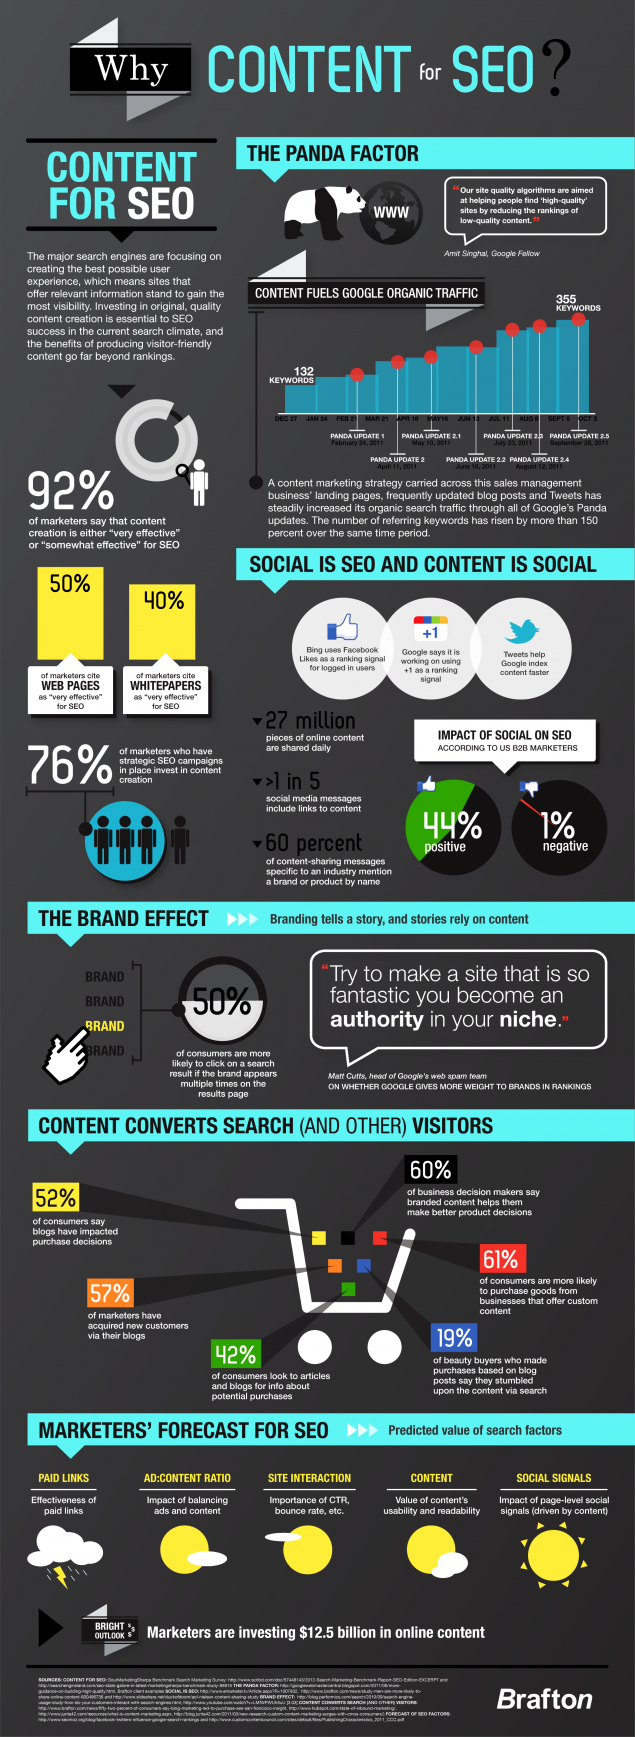
The second infographic really drives home the old saying "content is king."
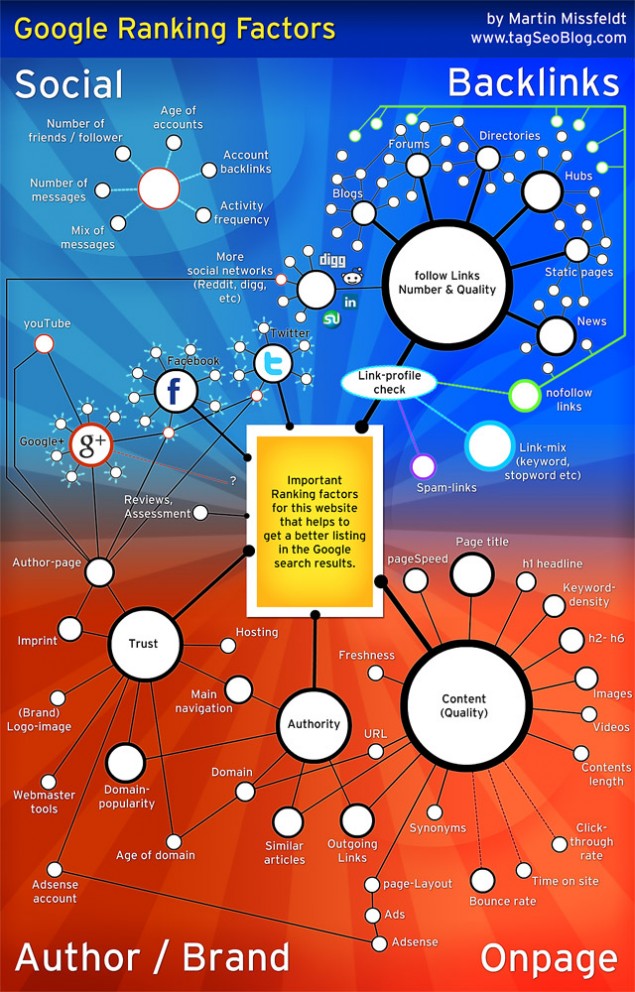
This third infographic is not terribly interesting, in my opinion, but I guess it's a nice visualization of Google's algorithm.
This fourth infographic is kind of an intense overview of how to optimize (but not over-optimize) your site. What I find interesting is the stat that search outranks social media in terms of traffic driven to sites by 300% (see Tip #2). There's been a lot of buzz around the fact that social media is overtaking search in terms of discovery, but search clearly has the lead. I'm also not exactly sure whether or not social will beat search in the long run. I read recently (can't remember where) that we're leaving the information age and entering the recommendation age. That would suggest social is taking over, but I don't think the recommendation age will completely ignore the benefits of the information age. Social is just one influence in my opinion.
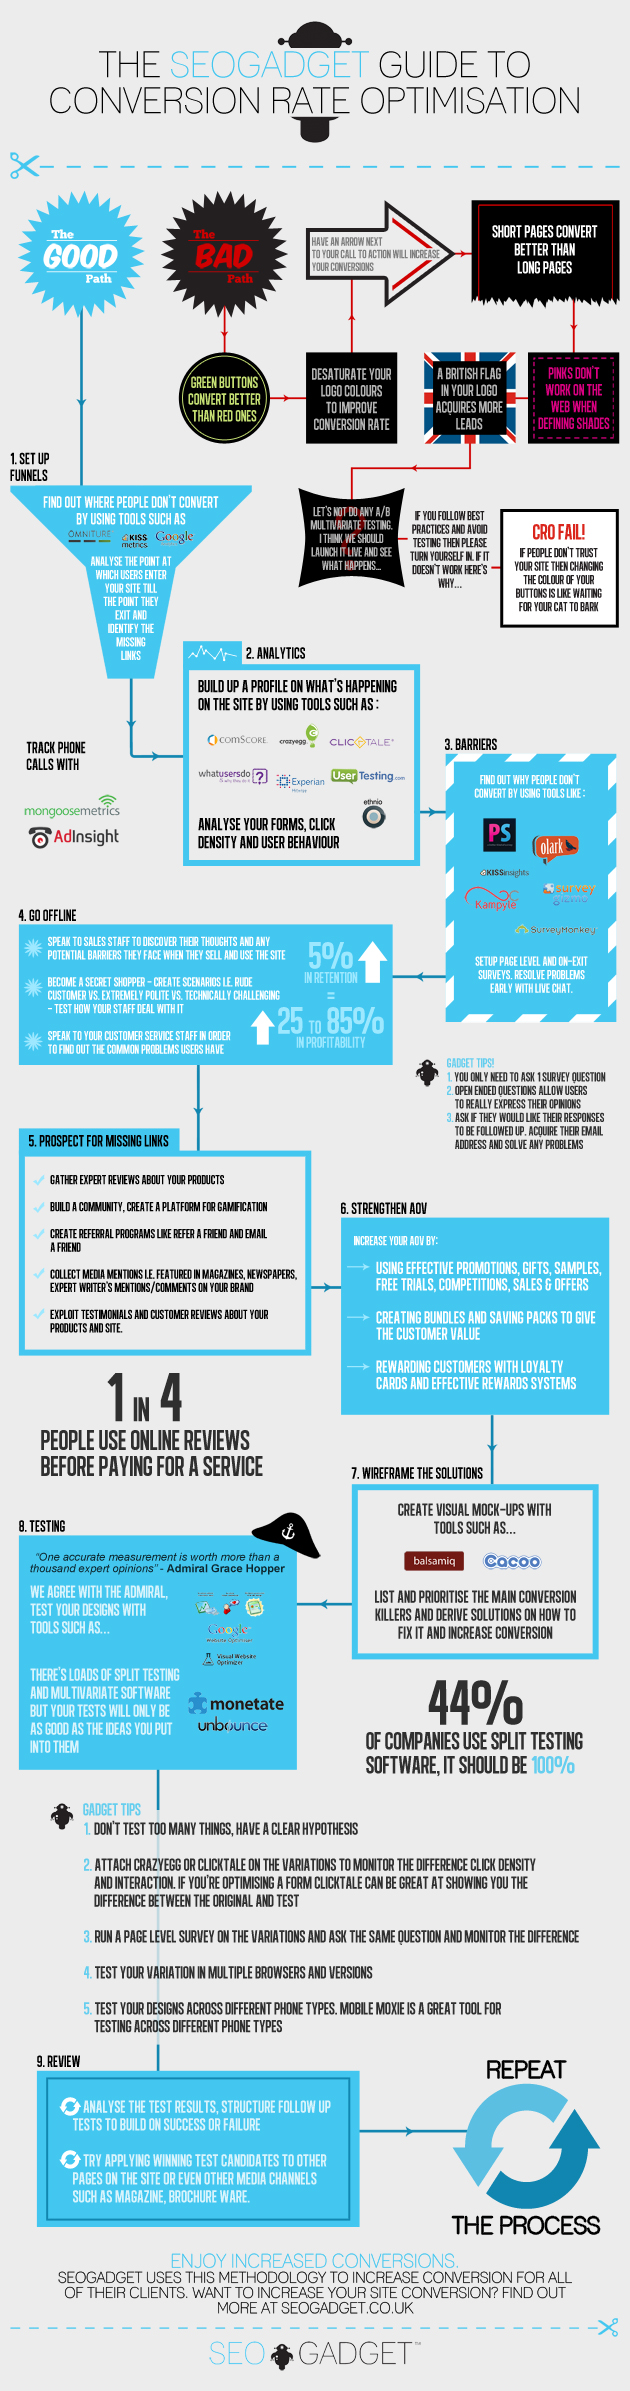
This final graphic offers two ways of improving conversion metrics. The "Bad Path" is clearly a joke, but there are some aspects of it that I've heard, so this is helpful in debunking some common myths. It also stresses the point that obsessively tracking everything is paramount to ensure success. You can't just set up a campaign/website and assume things will go swimmingly from there.
No comments:
Post a Comment